

You all may have heard about Power BI and Tableau, but probably didn’t know much about them. To Begin with, Power BI and Tableau are two increasingly popular and important Business Intelligence tools for the collection, Integration, and analysis of information. In addition, Both these tools (Power BI and Tableau) help you in Data analysis. Furthermore, also helps with Data manipulation, and visualization of data to improve the Business by drawing Insights and Problems. In Conclusion, these are important tools to run a certain Business, with the inclusion of Artificial Intelligence. In this article, we’ll discuss everything regarding Power BI vs Tableau. Such as history, cost, similarities, Differences, User Interface, Cost, Functions, and more.
Table of Contents
Listen to this article- Power BI vs Tableau
Definitions of Tableau and Power BI-
Power BI-
Salesforce acquired Power BI to visualize and analyze vast Volumes of data and creates graphs and Charts for enhancement. It has an Intelligent Interface. Unlike, Tableau, Power BI has an Ask Data feature.
Tableau-
Tableau is visual data analysis software, to prepare a report for enhancement, which is provided by Microsoft. It has a Simple Interface and comes up with DAX (Data Analysis Expressions).
History of Tableau and Power BI-
Power BI-
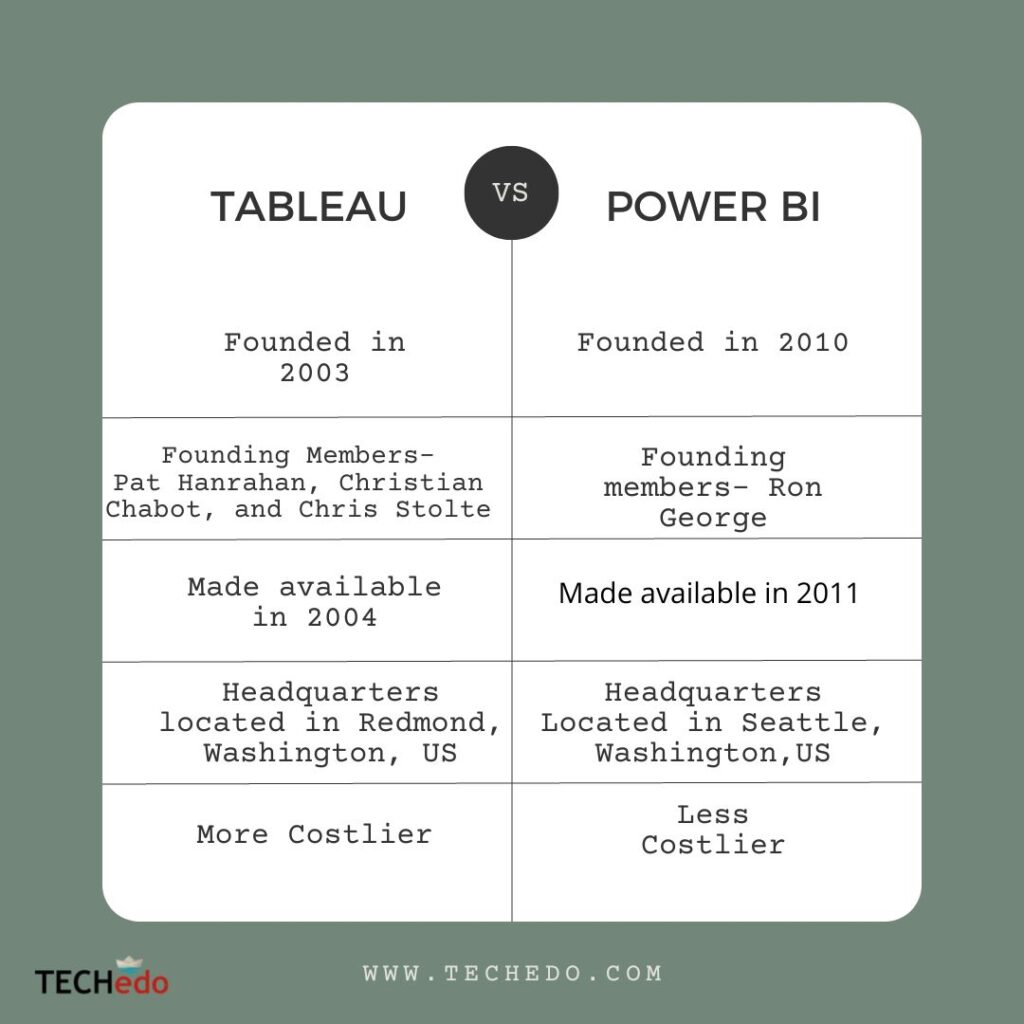
In 2010, Ron George originally designed Project Crescent. However, it was initially made available to the public on 11 July 2011, with the support of SQL Server. Therefore, In September 2013, Microsoft renamed Project Crescent Power BI. In the coming two years, Power BI has undergone many Changes. In the end, It was made available to the general public on July 24, 2015. Since then, it has become a major business Intelligence Service, in the market. Moreover, Power BI includes Software Products, such as, Power BI Service, Power Desktop, and Power BI Gateway.
Tableau–
In January 2003, Pat Hanrahan, Christian Chabot, and Chris Stolte founded the business Intelligence based data visualization tool, in California. Moreover, Salesforce acquired tableau for $15.7 billion. Currently, its headquarters are located in Seattle, Washington. Software products of Tableau include Tableau Cloud, Tableau Mobile, Tableau Desktop, Tableau Server, Tableau Prep, and Tableau CRM.
User Interface- Power BI vs Tableau-
Power BI-
Power BI has an intuitive Interface, and it has the capability to integrate with other Microsoft Products. It is easy and very user-friendly and allows to operate better.
Tableau-
Unlike Power BI, Tableau has an Intelligent Interface and the Capability to create and customize dashboards. Tableau Interface, also includes a Workspace area, that encourages users to do data visualization in the need of effective results.
Performance and Cost- Power BI vs Tableau-
Power BI-
As said earlier, Power BI is very easy and user-friendly. It works fast only when the data is Limited. However, with a huge volume of data, Power BI drags slowly. If we talk about Power BI, It is very Cheap than Tableau. The Subscription to Power BI is priced at $4,995 a month.
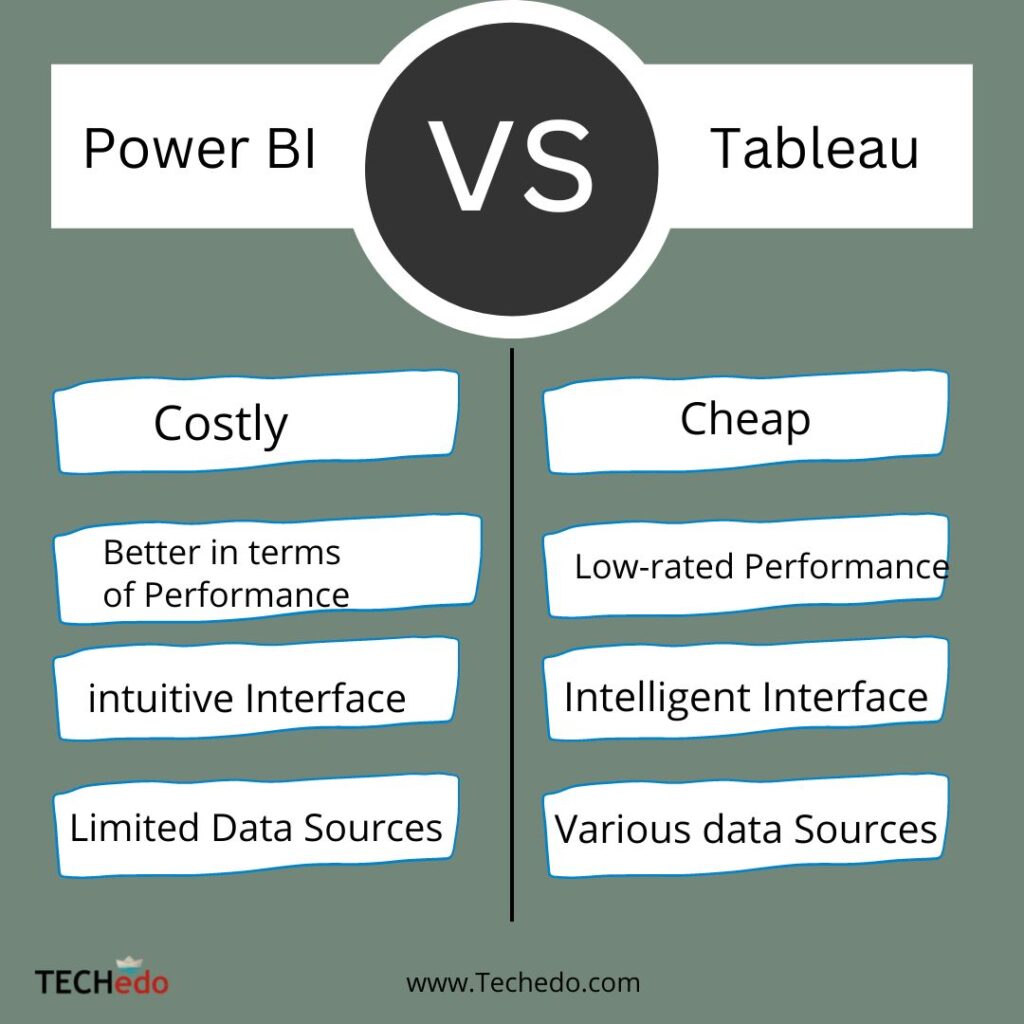
Tableau-
Unlike Power BI, Tableau is very fast in terms of everything. Moreover, It works properly when there is a huge volume of data present. In short, Performance-wise, Tableau is much better than Power BI. Therefore, Tableau is costlier than Power BI, $12 is the fixed price for Tableau Premium.
Data Sources- Power BI vs Tableau-
Power BI-
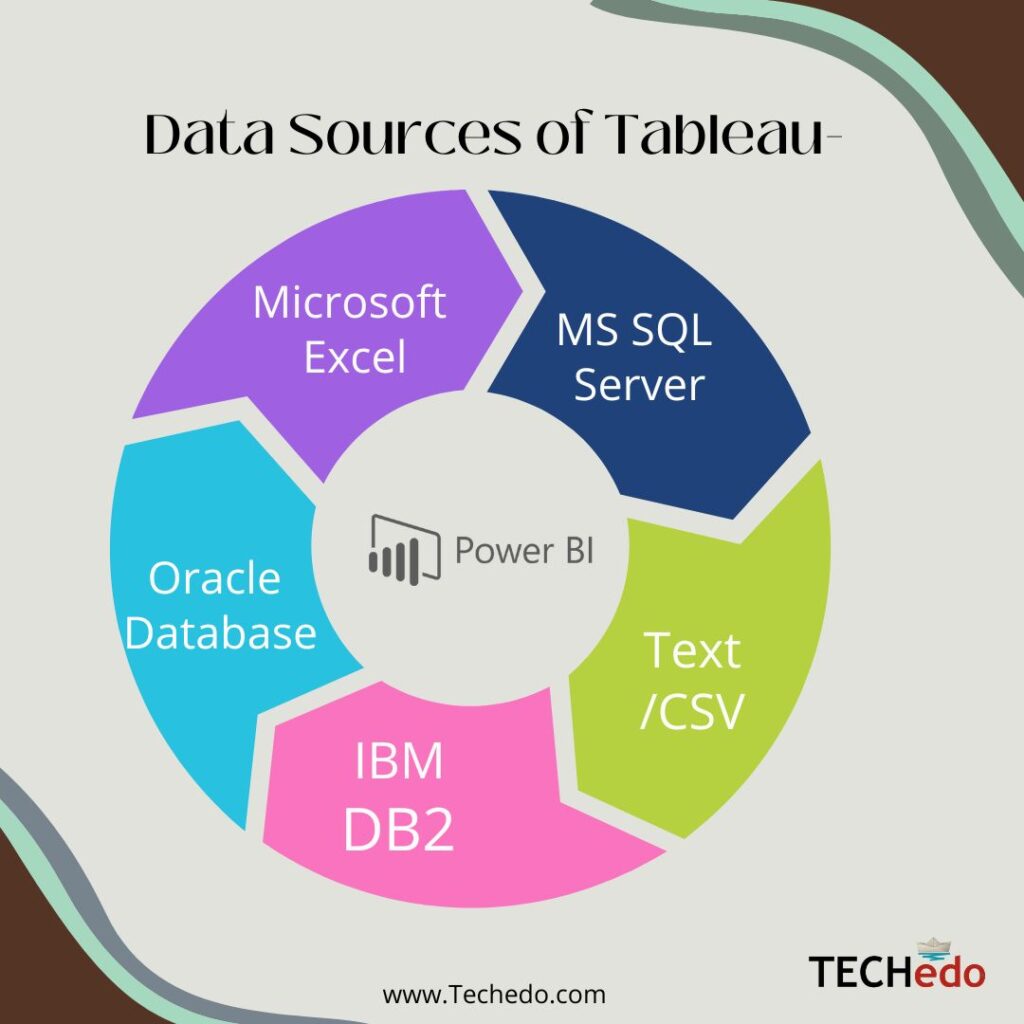
Power BI has an access to various data sources, but still less than Tableau. Microsoft Excel, Folders, MS SQL Server, Oracle Database, IBM DB2, Text/CSV, and PostgreSQL database are some of the main data Sources.
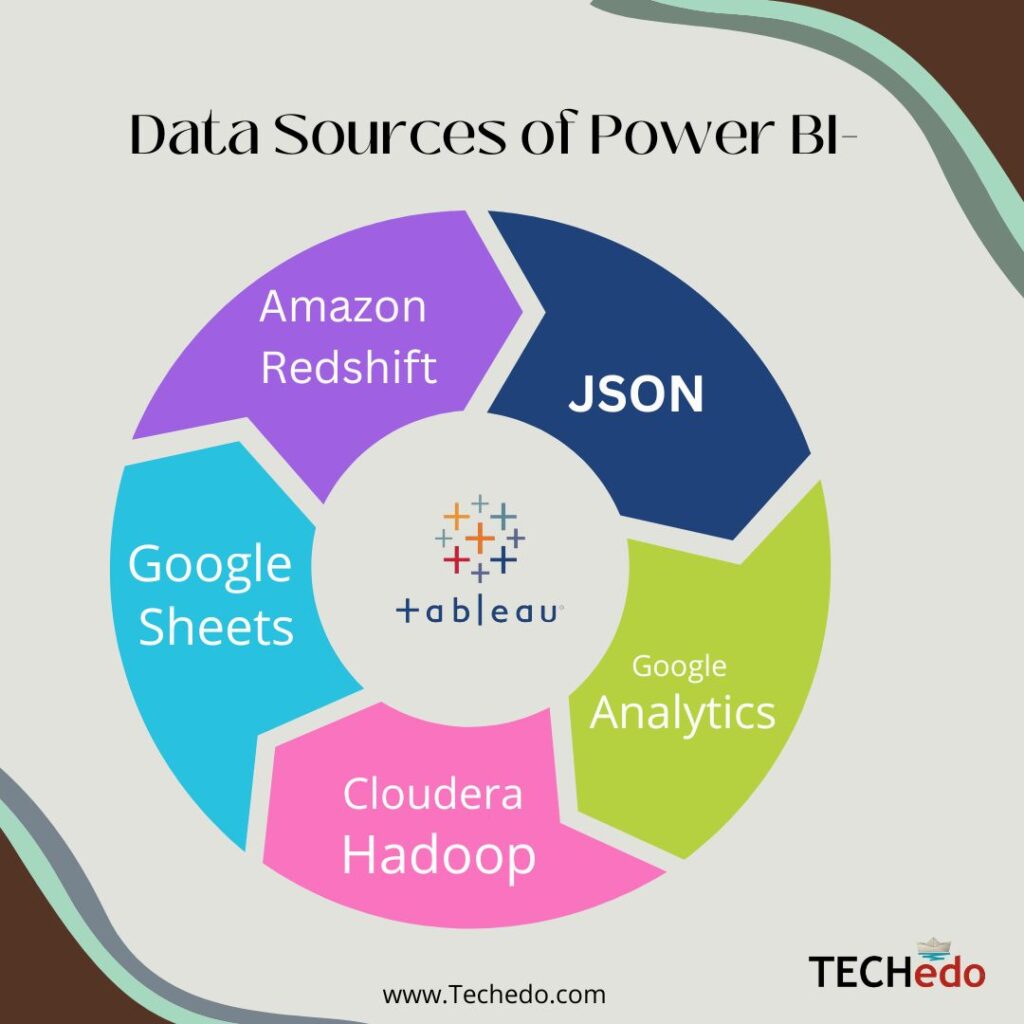
Tableau-
Unlike Power BI, Tableau has much more data sources than Power BI. Database and Servers such as JSON, Amazon Redshift, Cloudera Hadoop, Google Analytics, google sheets, google drive, and others.
Summing it Up-
In Conclusion, it’s your call, which data visualization tool is more suitable for you. Differences in terms of their performance, cost, and Data Sources are mentioned in the Article.
Frequently Asked Questions-
Q-1. Tableau vs Power BI– Which is easy to learn?
Ans- Both Tableau and Power BI are easy to learn. But Power BI is much easier than Tableau. Moreover, Tableau has an intelligent Interface, which enables users to learn some complex skills. As result, Tableau becomes more complex.
Q-2. Tableau vs Power BI- Salary?
Ans- On Global Level, the Tableau Developer’s Salary is more than the Power BI Developer’s Salary. The reason for this difference is very apt, as Power BI is for small scale businesses, whereas Tableau is more professional and for Large-scale Businesses.
Q-3. Tableau vs Power BI- which is Costlier?
Ans- If we talk about Power BI, It is very Cheap than Tableau. The Subscription to Power BI is priced at $4,995 a month. Whereas, $12 is the fixed price for Tableau Premium.
Q-4. Tableau vs Power BI- Market Share?
Ans- According to the reports, As of 2021, Tableau has more market share than Power BI, 12.97% with 31,568 companies. However, Power BI has a market share of 5.43% with 13,201 companies.
Q-5. Tableau vs Power BI– Better Job Placements?
Ans- Although Tableau is much costlier than Power BI and is also better, in terms of Performance-wise. This results in better Job Placements for Tableau than Power BI. According to many reports, Tableau has more than half of the market share of Power BI in the market.
Q-6. Tableau vs Power BI- Salary in India?
Ans- In India, Power BI Developer earns a salary between 6 Lakh to 9 Lakh (Annually) , whereas Tableau Developer earns an annual salary between 9.5 Lakh to 12 lakh. In certain areas, the Salary is even more than 12 lakh.


0 Comments